The Science
The evidence behind the Values Alignment Index®
A well-established theory, an independently assessed instrument and a wider body of workplace research. Each answers a different question — and each has its limits.
01 · The framework
Schwartz’s theory of basic human values
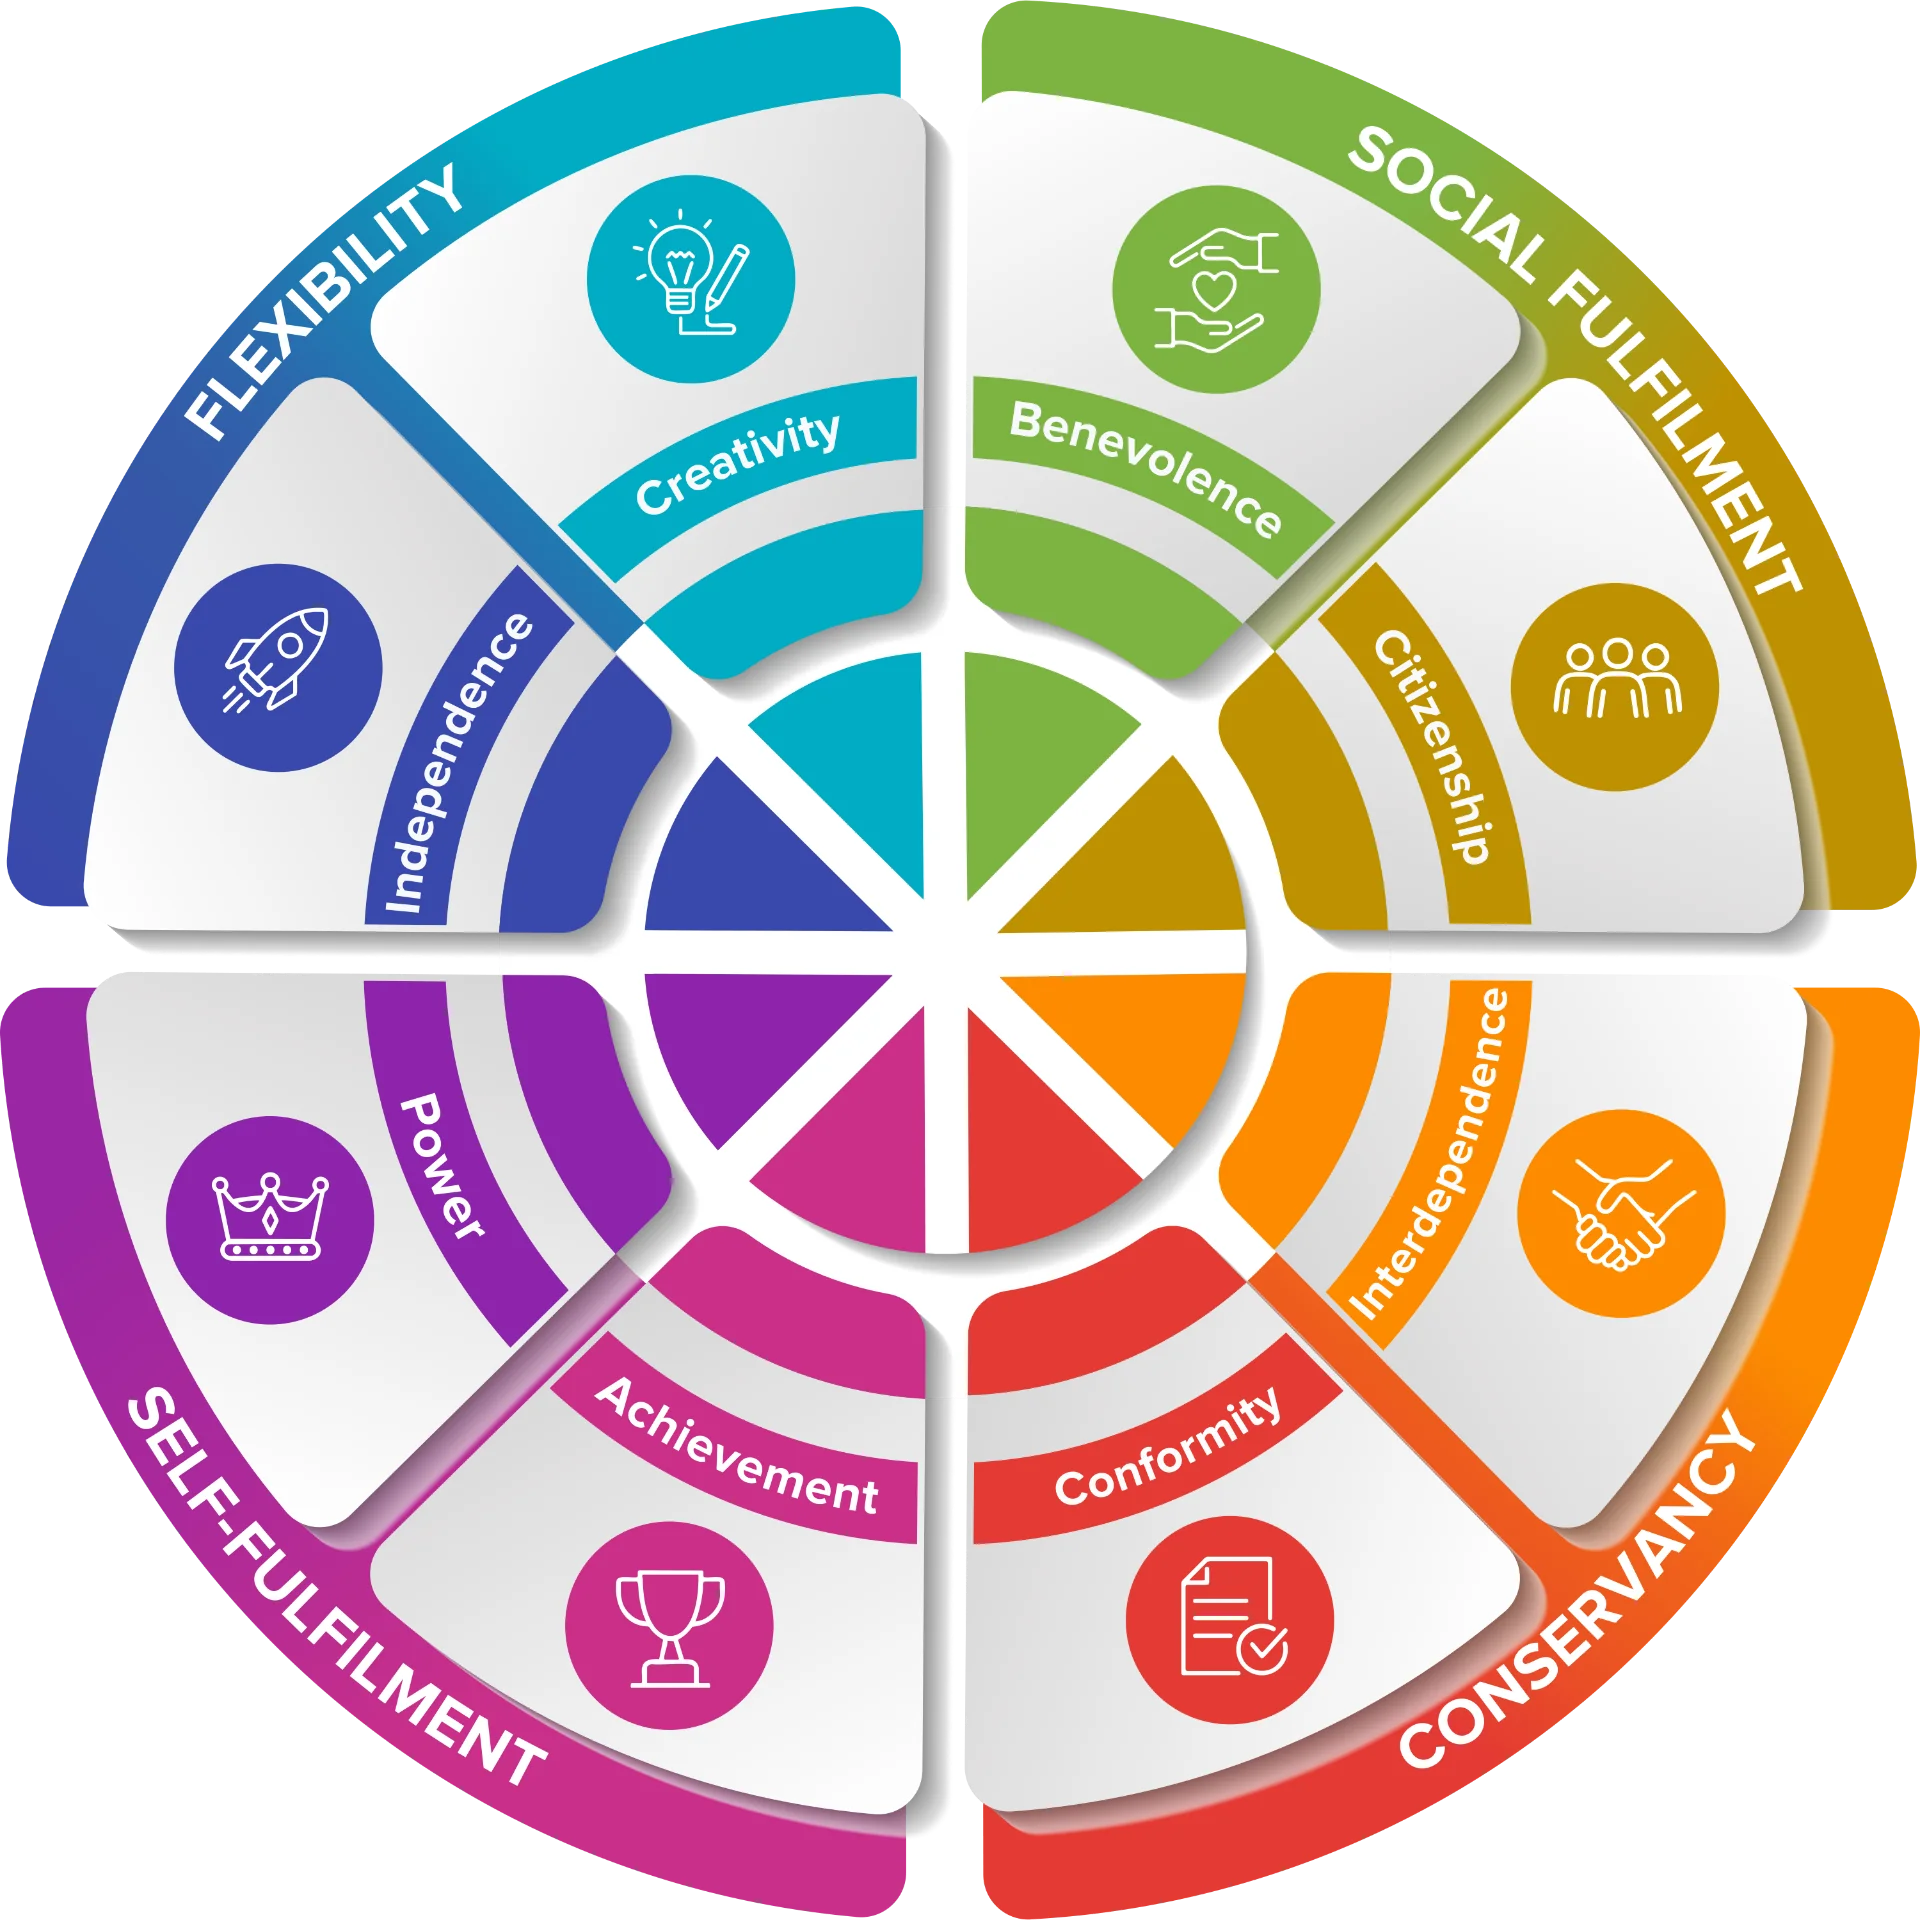
Shalom Schwartz’s theory describes the motivations behind what people consider important, and the relationships between them. The Values Alignment Index® is built on this framework, used with Professor Schwartz’s permission.
Schwartz’s 2012 overview reports evidence from 82 countries for the cross-cultural structure of basic values. This is evidence for the underlying framework, not an 82-country validation of the Index itself. Values are relatively stable over time, rather than fixed.
Source: Schwartz (2012), An Overview of the Schwartz Theory of Basic Values
Source for the 60,000+ figure: Schwartz (2003), A Proposal for Measuring Value Orientations across Nations, European Social Survey — 64,271 respondents in 210 samples from 67 countries.
02 · The instrument
Independent assessment of the Index
In 2023 a Chartered Occupational Psychologist assessed the Index’s reliability and construct validity with 374 UK working adults. The review found acceptable internal consistency across three of the four value pairs, with the fourth marginally below the conventional threshold, and significant positive correlations between every Index item and corresponding items in Schwartz’s Portrait Values Questionnaire. The review concluded that the validity demonstrated is sufficient for use in practice.
- 374
- UK working adults in the validation sample
- α 0.63–0.77
- Internal consistency across the four value pairs
- 4 of 4
- Value pairs correlating significantly with Schwartz's PVQ
- Normed
- Scores referenced against a UK working-population sample
What the figures mean
Internal consistency indicates how closely questions within each value pair measure the same orientation. Cronbach’s alpha ranged from 0.63 to 0.77. The PVQ correlations provide evidence of construct validity — that the Index measures the values it is intended to measure.
How scores are interpreted
Scores are norm-referenced against the UK working-population sample. The review does not establish test–retest reliability or direct prediction of job performance, and its UK norms should not be treated as international norms.
Source: independent 2023 Values Alignment Index assessment, 374 UK working adults. These instrument results are supplied by &Evolve; they are distinct from the published framework and workplace studies below.
03 · Workplace outcomes
What values alignment can — and cannot — predict
The academic evidence is consistent: values alignment reliably predicts commitment, intention to stay and discretionary effort, with a small and largely indirect effect on task performance. The best available evidence shows it works primarily through trust and the quality of communication.
(Kristof‑Brown et al., 2005; Arthur et al., 2006; Edwards & Cable, 2009; Rahn, Soutar & Lee, 2020)
These studies concern values congruence and person–organisation fit more broadly. They do not demonstrate that this Index directly predicts an individual’s performance. Alignment should inform judgement alongside skills, experience and context, rather than dictate recruitment decisions.
Sagiv & Schwartz (2000) examined subjective wellbeing and values congruence in two small student samples — not burnout or clinical mental health. Rahn, Soutar & Lee examined employees’ change beliefs, not direct task-performance prediction.
Sources
- Kristof-Brown, Zimmerman & Johnson (2005) — Consequences of Individuals’ Fit at Work: A Meta-Analysis of Person–Job, Person–Organization, Person–Group, and Person–Supervisor Fit
- Arthur, Bell, Villado & Doverspike (2006) — The Use of Person-Organization Fit in Employment Decision Making: An Assessment of Its Criterion-Related Validity
- Edwards & Cable (2009) — The Value of Value Congruence
- Rahn, Soutar & Lee (2020, online first; 2023 journal issue) — Perceived Values-Congruence and Employees’ Change Beliefs
- Sagiv & Schwartz (2000) — Value Priorities and Subjective Well-Being: Direct Relations and Congruity Effects
The independent validation summary is available on request.
Request the summary